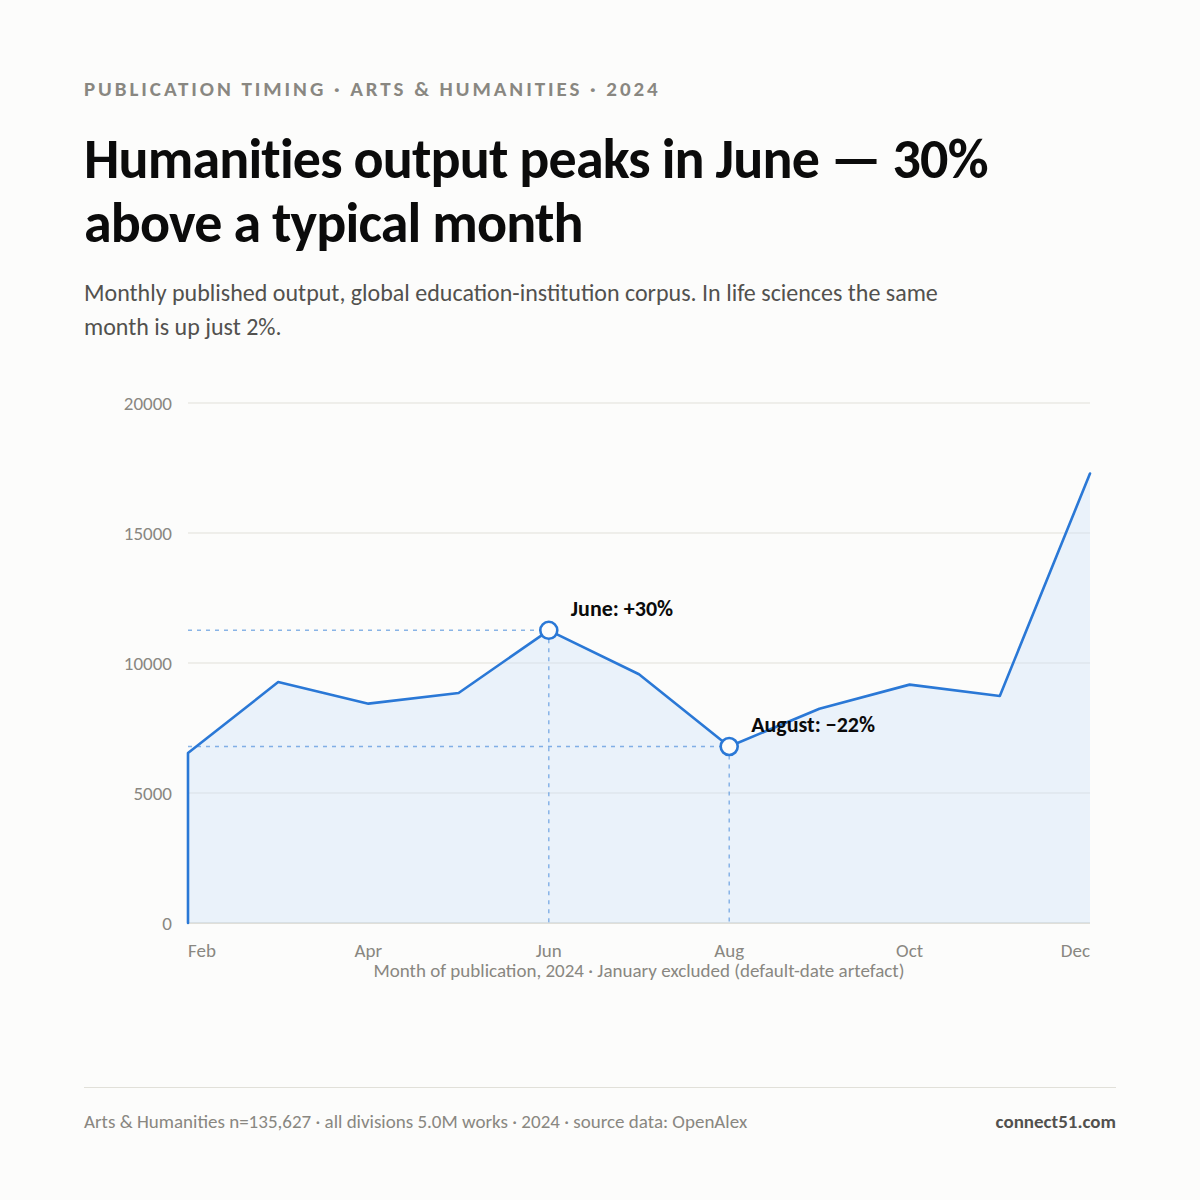
In 2024, arts and humanities output peaked in June at 30% above a typical month.
In 2024, arts and humanities output peaked in June at 30% above a typical month. In life sciences, the same month was up 2%. Publication timing isn't a shared calendar — it's a property of each discipline's journal cycle, and humanities, social science and business titles bunch their issues into June and December. If your quarterly reporting to deans compares Q2 against Q1 without adjusting for discipline mix, a humanities-heavy faculty will look like it is surging and a lab-based one like it is stalling. Neither is doing anything different.
Curious how your own discipline mix shapes your quarterly numbers? We run free Connect51 trials for research offices — comment or DM me, or start at https://www.connect51.com
#Connect51 #ResearchManagement #ResearchImpact #OpenAlex #ResearchOffice
See more →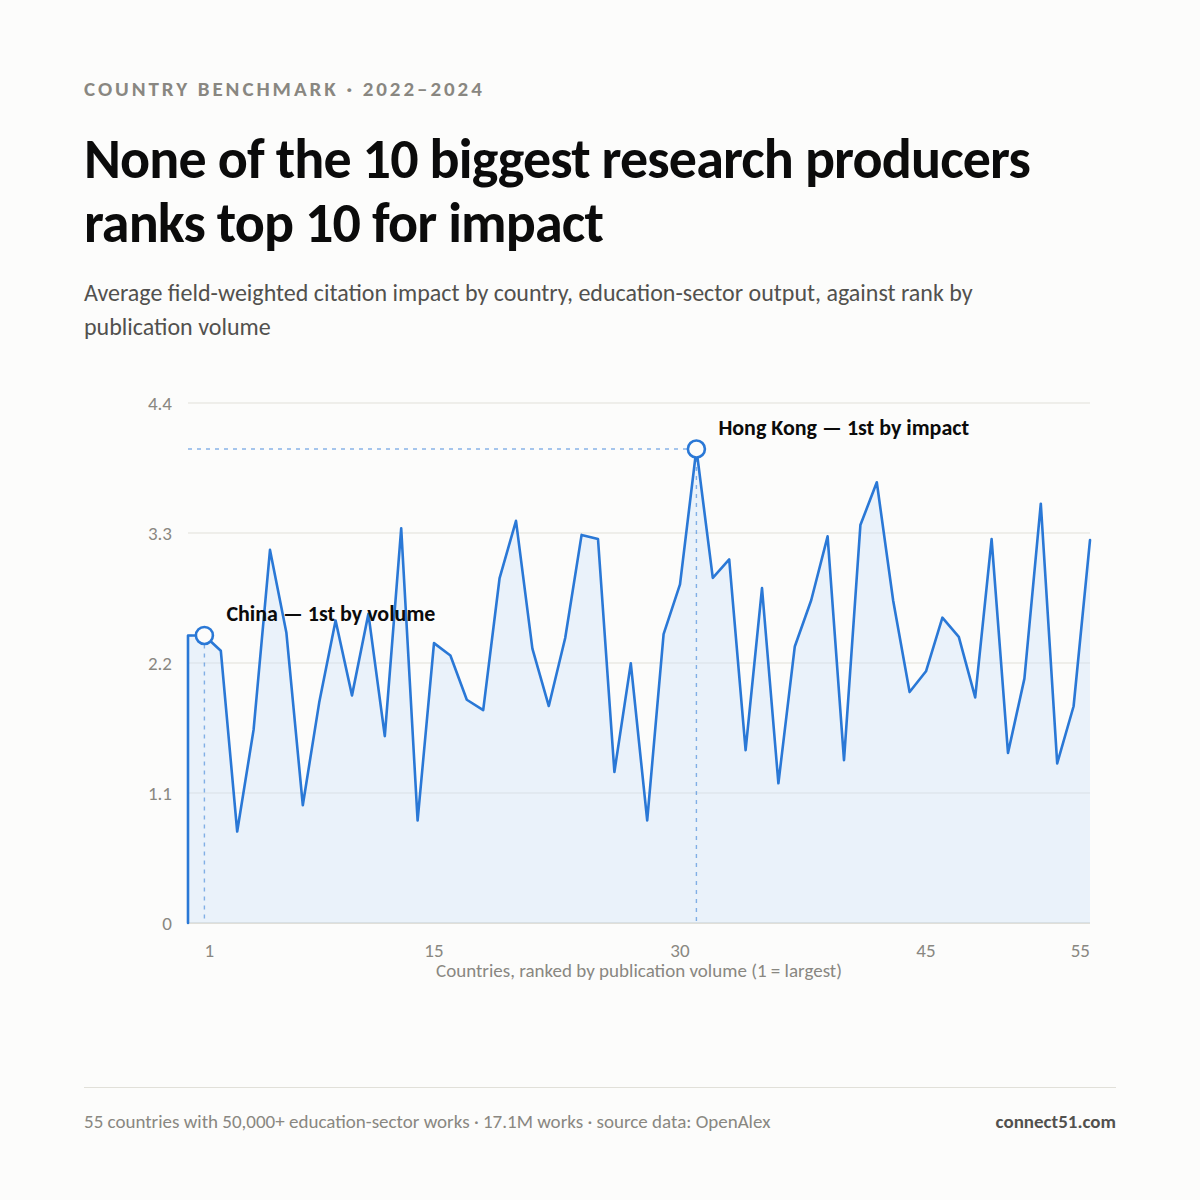
Across 55 countries with at least 50,000 university outputs between 2022 and 2024, not one of the ten largest producers appears in the top ten for average field-weighted citation impact.
Across 55 countries with at least 50,000 university outputs between 2022 and 2024, not one of the ten largest producers appears in the top ten for average field-weighted citation impact. Hong Kong ranks first on impact and 31st on volume; China and the US, first and second by output, sit 25th and 31st. The rank correlation between the two measures is slightly negative. For a research office, that is the case against volume targets: scale and influence are separate levers, and the benchmark you pick decides which strategy looks like it is working.
Curious where your institution sits on the same volume-versus-impact split? We run free Connect51 trials for research offices — comment or DM me, or start at https://www.connect51.com
#Connect51 #ResearchManagement #ResearchImpact #OpenAlex #ResearchStrategy
See more →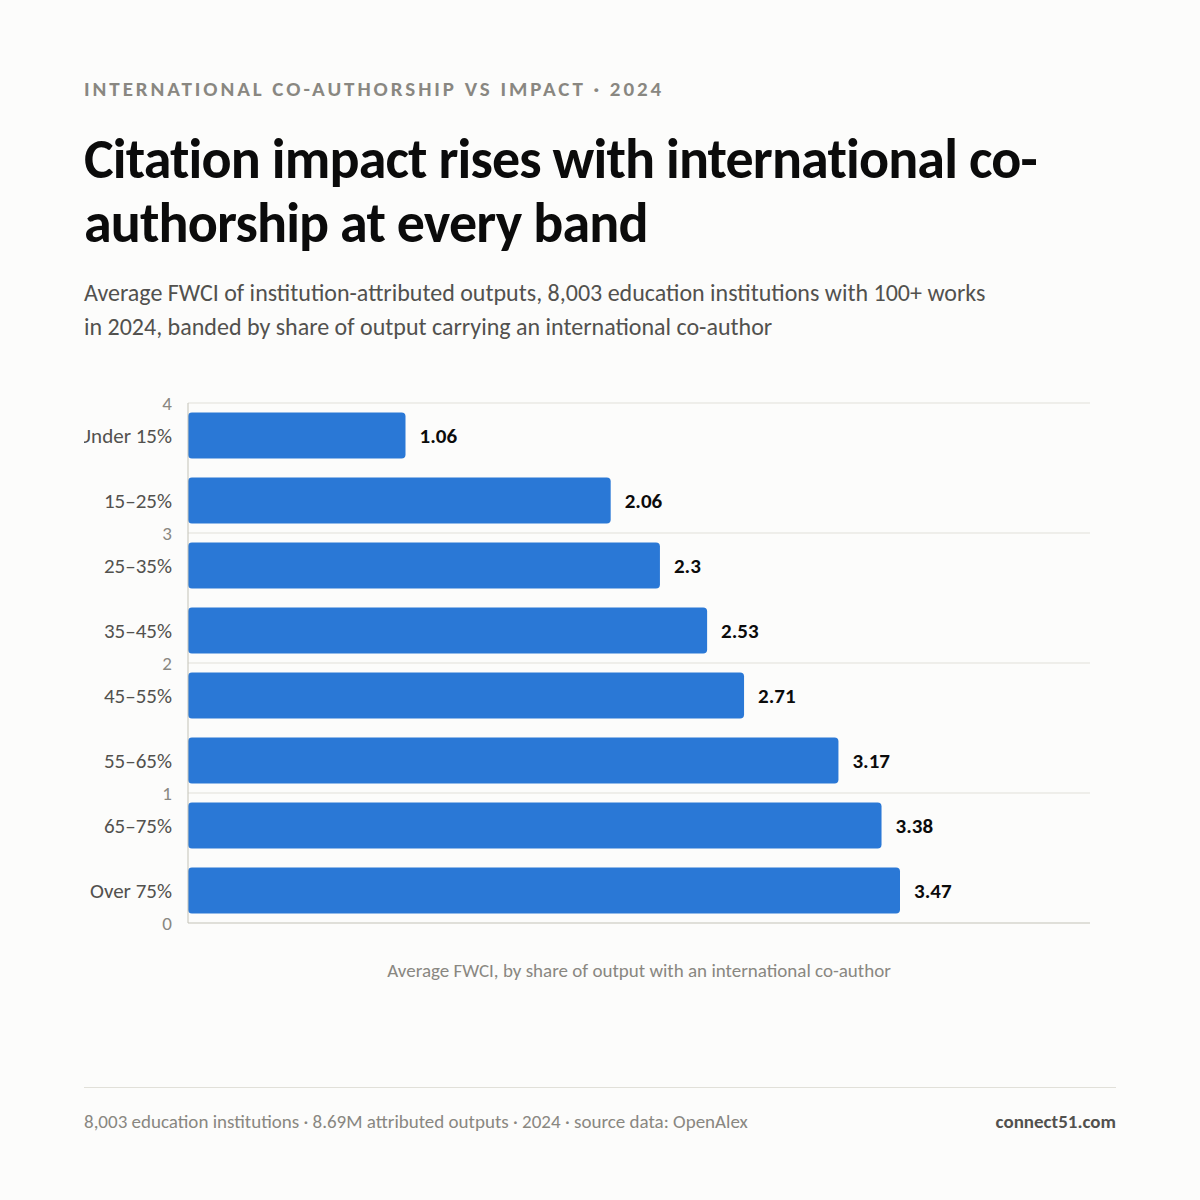
Across 8,003 universities that published 100+ works in 2024, average field-weighted citation impact rises from 1.06 to 3.47 as international co-authorship increases.
Across 8,003 universities that published 100+ works in 2024, average field-weighted citation impact rises from 1.06 where under 15% of output has an international co-author to 3.47 where it's above 75% — a 3.3x spread, climbing at every band in between. The median university sits at 33%. For a research office that reframes internationalisation from a reputational nicety into the strongest steerable correlate of citation performance in this data: partnership strategy, mobility schemes and co-funded calls move it, discipline mix largely doesn't.
Curious where your institution falls on that curve? We run free Connect51 trials for research offices — comment or DM me, or start at https://www.connect51.com
#Connect51 #ResearchManagement #ResearchImpact #OpenAlex #HigherEducation
See more →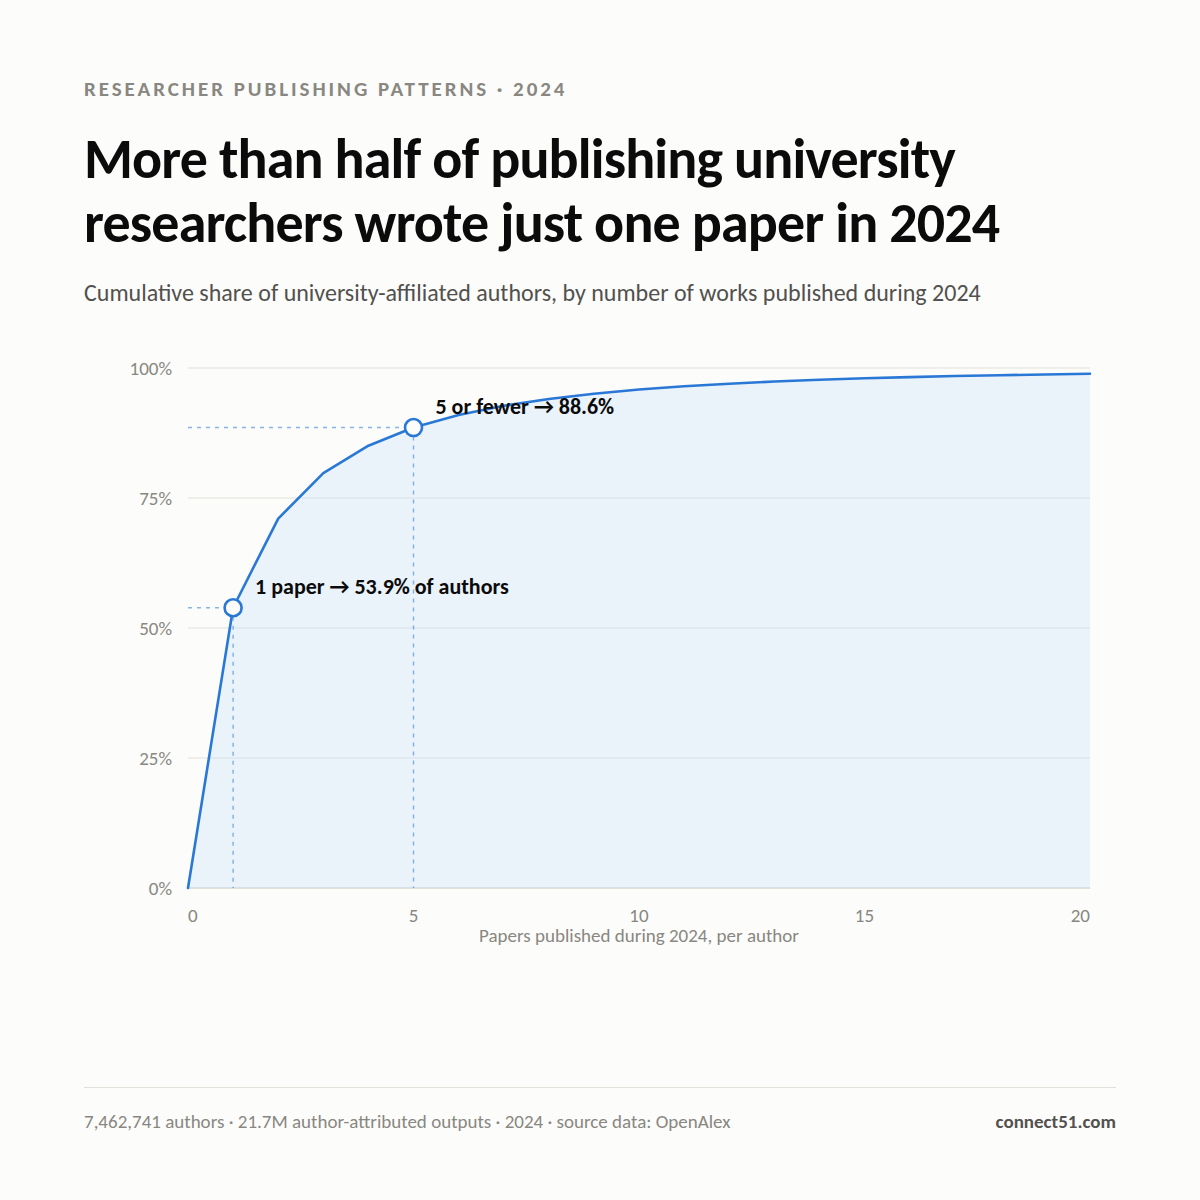
In 2024, 53.9% of university-affiliated researchers who published anything published exactly one paper.
In 2024, 53.9% of university-affiliated researchers who published anything published exactly one paper. Those 4.0 million people account for just 18.5% of output, while 83,567 researchers — 1.1% of the population — produced 14.2%.
For a research office this reframes what "our researchers" means. Most names on an annual publication list are not repeat publishers: doctoral students finishing up, clinicians, occasional collaborators. Support models and internal metrics built around a stable core will miss over half the people who appeared in the record that year.
Curious how that one-paper share looks at your own institution? We run free Connect51 trials for research offices — comment or DM me, or start at https://www.connect51.com
#Connect51 #ResearchManagement #ResearchImpact #OpenAlex #Bibliometrics
See more →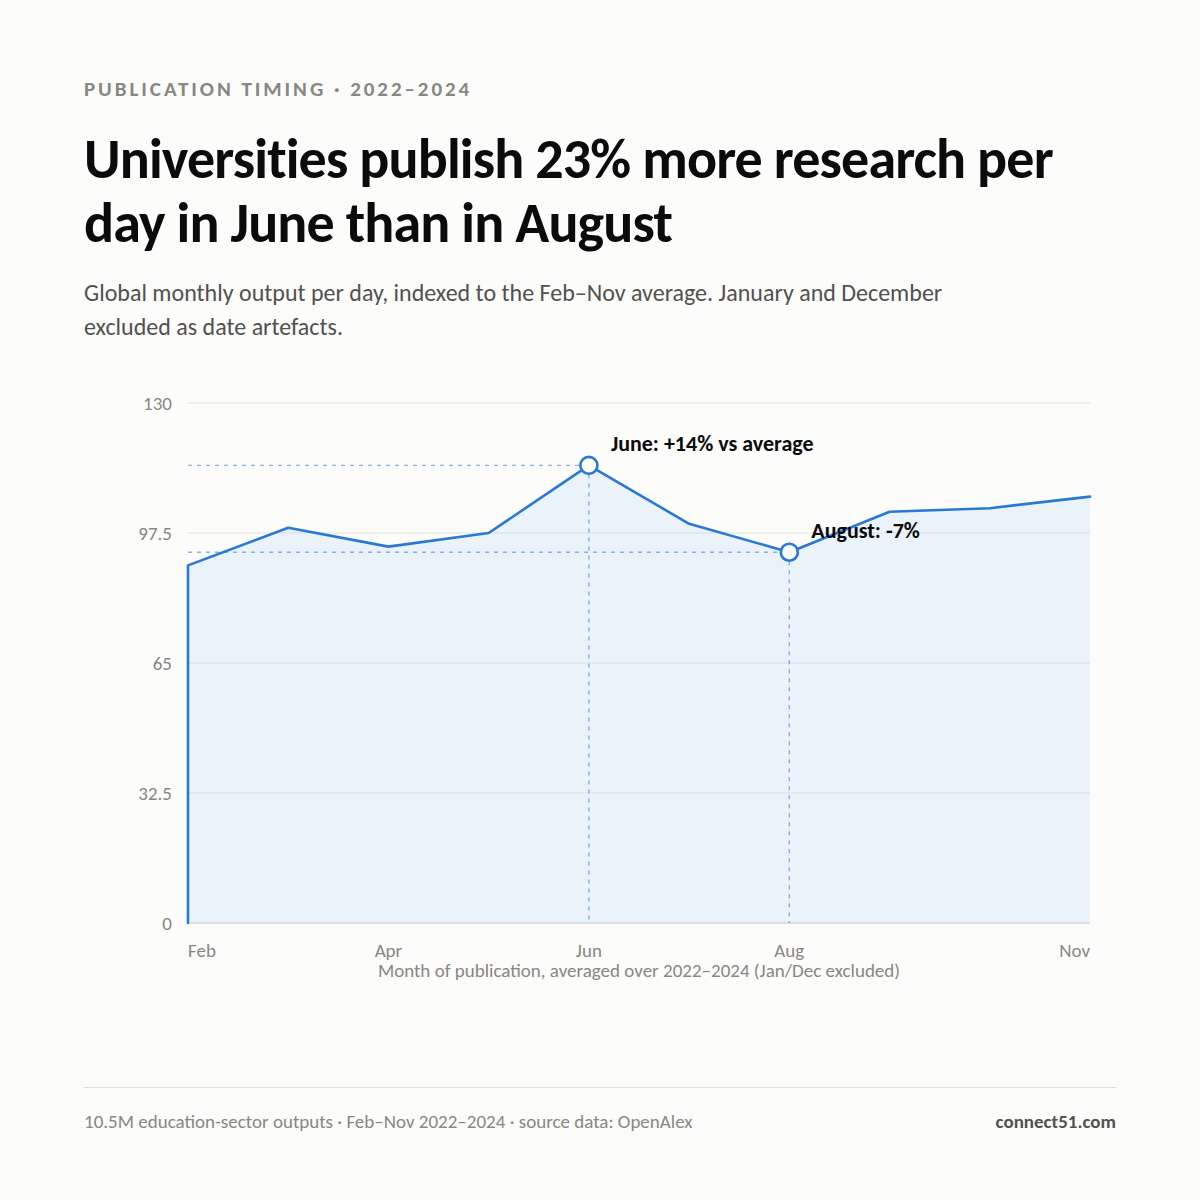
Across 2022-2024, universities worldwide published 23% more research per day in June than in August.
Across 2022-2024, universities worldwide published 23% more research per day in June than in August. The June spike is global; the August dip is not. France publishes 22% below its own annual pace in August and Spain 19%, while China shows no dip at all. That rhythm tracks national academic calendars and publisher schedules, not research capacity. Benchmark monthly or by quarter against an international peer set and Q3 reads as a Western European slump, Q2 as a global surge. Neither is performance.
Want to see your own institution's monthly curve against a peer group? We run free Connect51 trials for research offices — comment or DM me, or take a look at https://www.connect51.com
#Connect51 #ResearchManagement #ResearchImpact #OpenAlex #ResearchOffice
See more →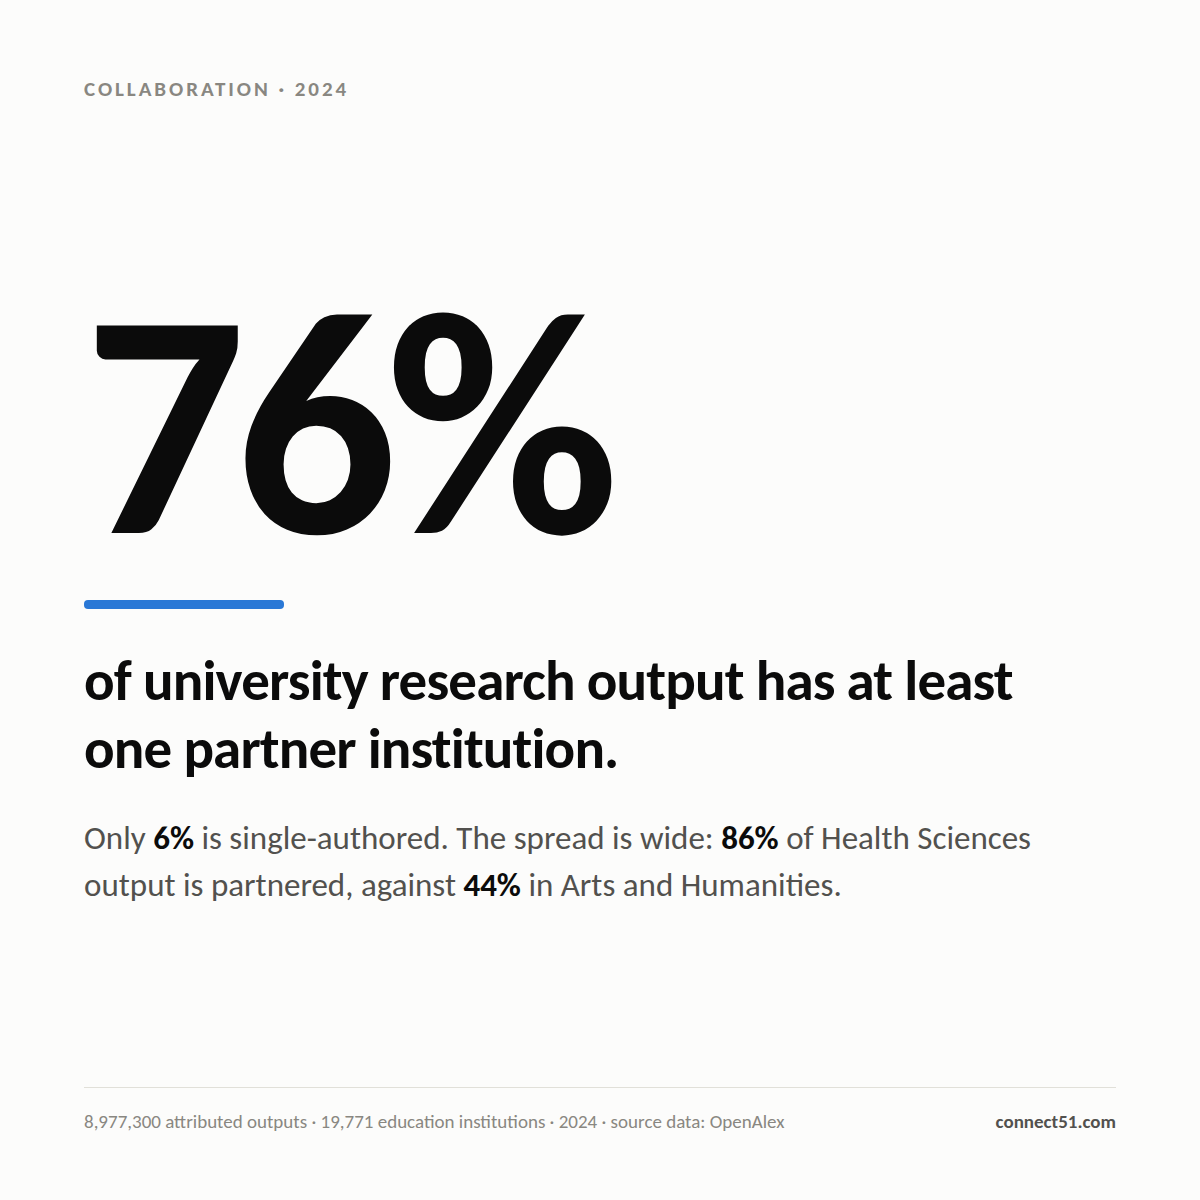
In 2024, 76% of university research output carried at least one external partner institution.
In 2024, 76% of university research output carried at least one external partner institution — and cross-border partnerships (38.8%) now edge out domestic ones (37.7%). The in-house paper is now the exception. For a research office that changes the job: most of your output is governed by agreements you co-signed, credit you share and compliance regimes you only partly control. The split is uneven, though. Health Sciences runs 86% partnered; Arts and Humanities only 44%. A single collaboration target across every faculty will flatter some departments and quietly penalise others.
Curious where your own faculties sit on that partnered-versus-in-house split? We run free Connect51 trials for research offices — comment below or DM me, or start at https://www.connect51.com
#Connect51 #ResearchManagement #ResearchImpact #OpenAlex #Bibliometrics
See more →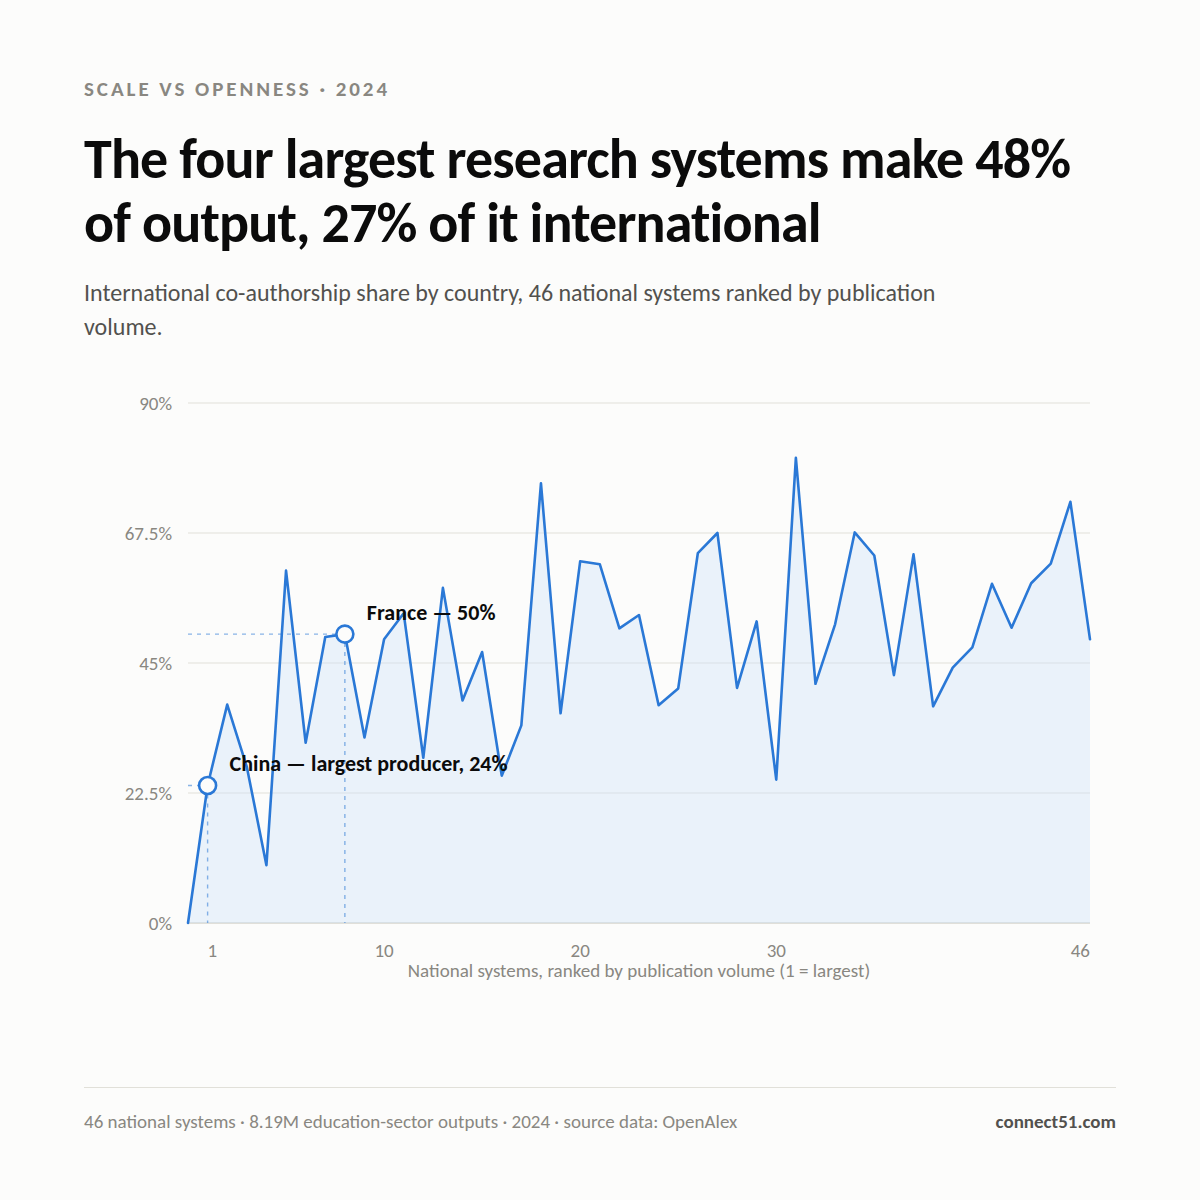
In 2024 the four largest university research systems produced 48% of the world's published output but recorded an international co-author on just 27% of it.
In 2024 the four largest university research systems — China, the US, India and Indonesia — produced 48% of the world's published output but recorded an international co-author on just 27% of it. The median across 46 national systems was 49%.
Scale and openness are not the same thing. For a research office this reframes benchmarking: a global average is pulled down by a few very large, largely domestic systems, so similar-sized peers are the fairer comparison.
Want to see where your institution sits against comparable systems rather than a global mean? We run free Connect51 trials for research offices — comment or DM me, or visit https://www.connect51.com
#Connect51 #ResearchManagement #ResearchImpact #OpenAlex #ResearchStrategy
See more →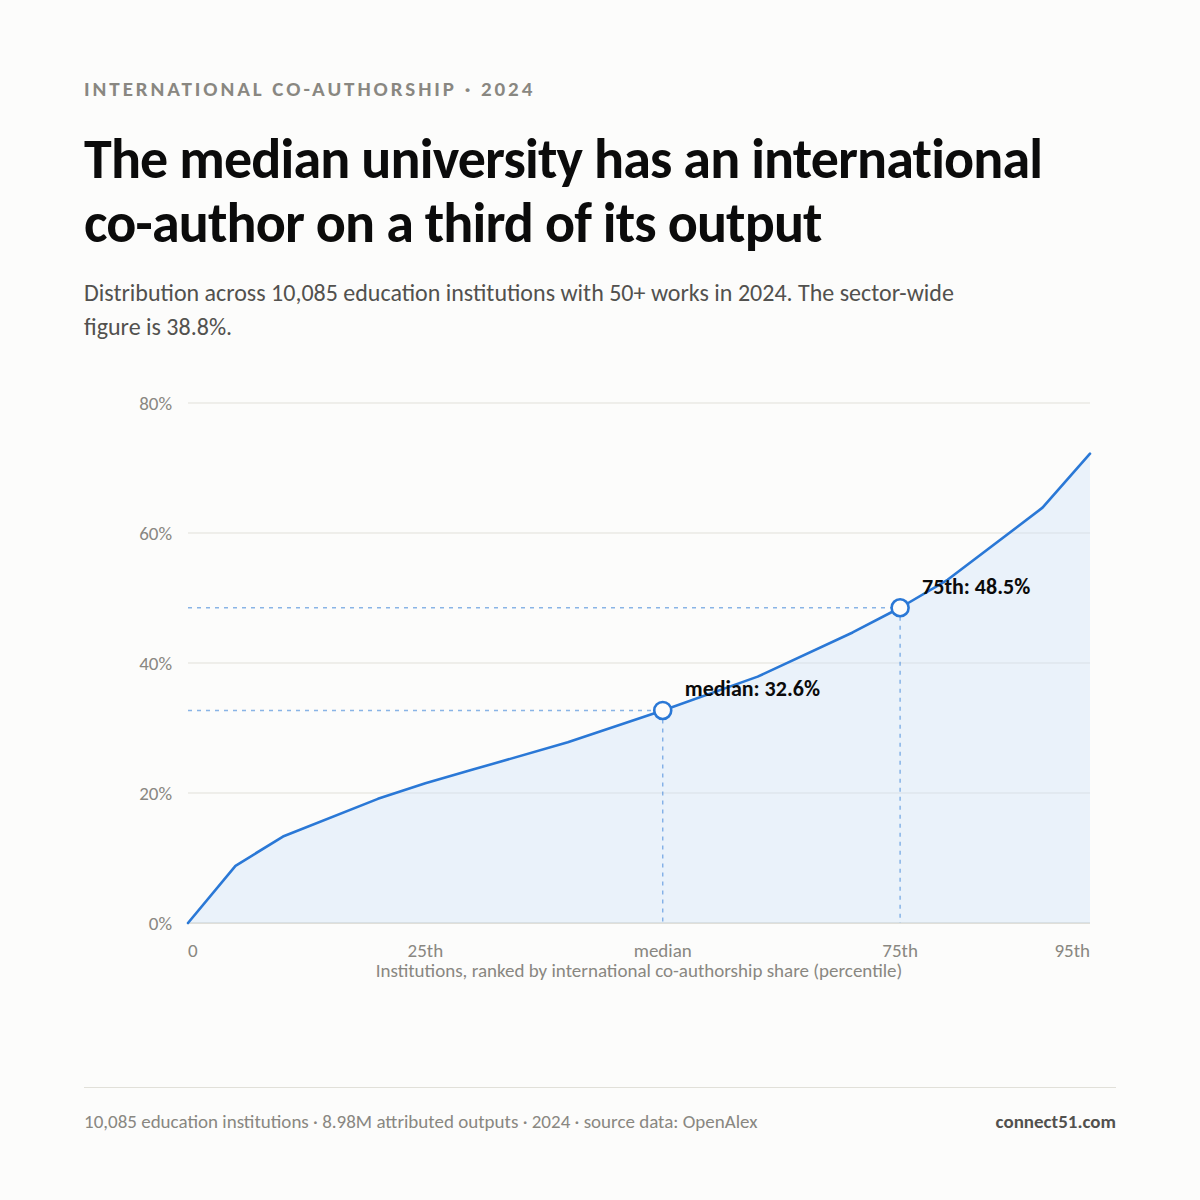
In 2024, the median university published 32.6% of its output with an international co-author.
In 2024, the median university published 32.6% of its output with an international co-author. The sector-wide figure is 38.8%, pulled up by the largest producers, and the middle half of institutions spans 21.6% to 48.3%. That gap matters when a sector average becomes an internal target: half of universities sit below 33%, so an office benchmarking against 39% is chasing a number no typical institution posts. Scale and discipline mix drive most of the spread, making size-matched peers the fairer comparison.
If you want to see where your own institution falls in that distribution, and how it shifts by discipline, we run free Connect51 trials for research offices — comment or DM me, or take a look at https://www.connect51.com
#Connect51 #ResearchManagement #ResearchImpact #OpenAlex #HigherEducation
See more →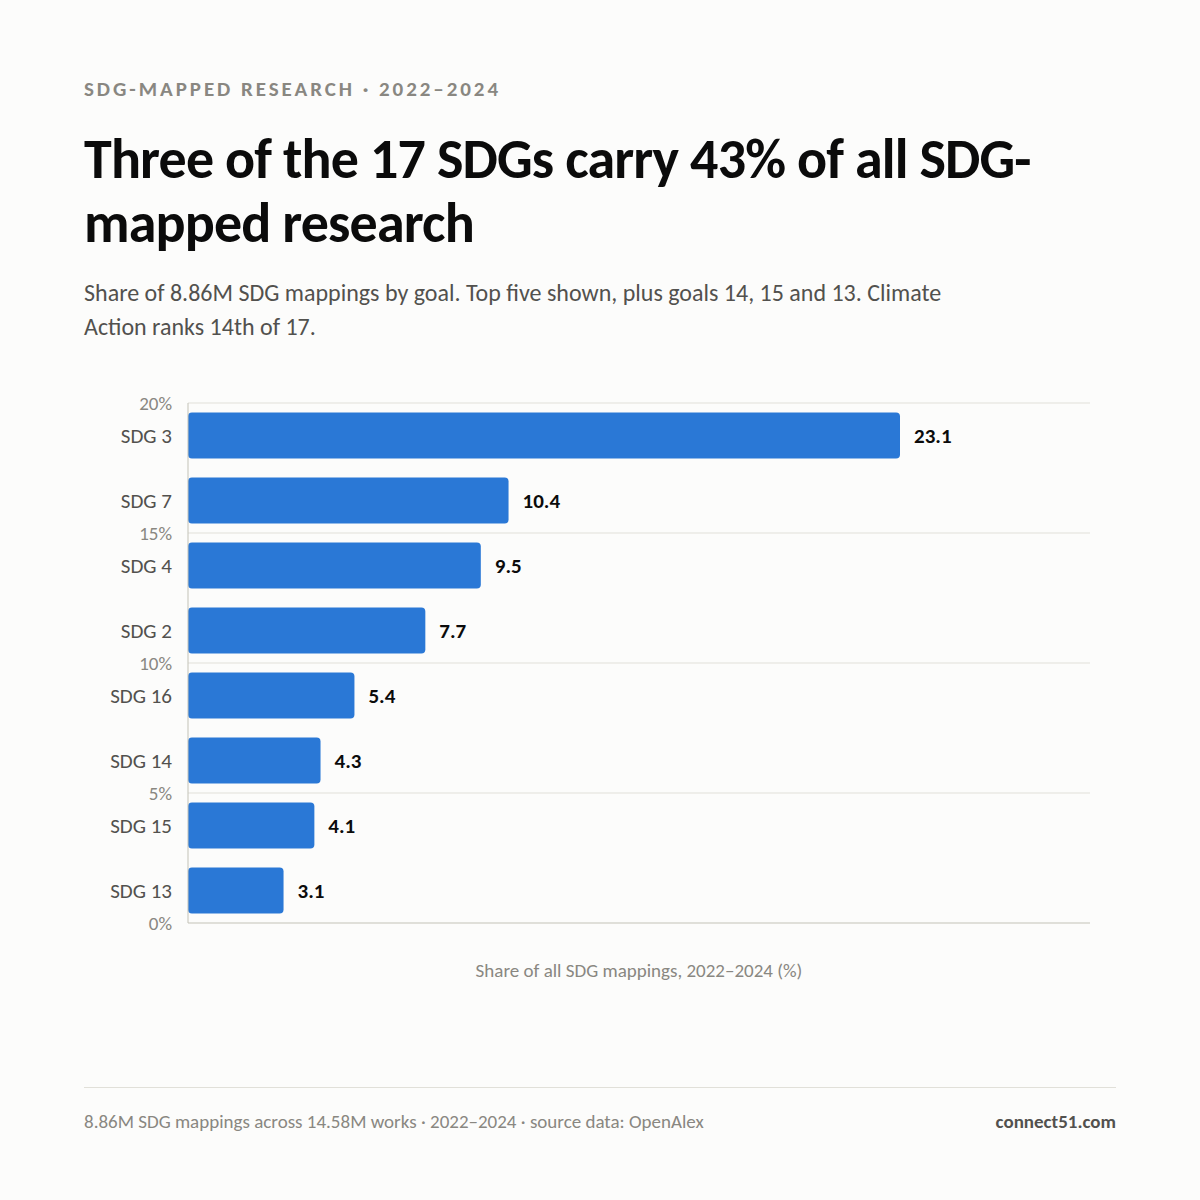
Three of the 17 Sustainable Development Goals account for 43% of all SDG-mapped research output published between 2022 and 2024.
Three of the 17 Sustainable Development Goals account for 43% of all SDG-mapped research output published between 2022 and 2024. Good Health and Well-being alone takes 23%. Climate Action sits 14th of 17, at 3.1% — behind Life Below Water and Life on Land.
That matters when you are benchmarked on SDG volume. The classification base is overwhelmingly health, energy and education research, so a climate-led institution can look thin next to a medical school without producing less. Worth knowing which denominator your ranking submission is competing in.
If you want the same 17-goal split for your own institution, we run free Connect51 trials for research offices — drop a comment or DM me, or start at https://www.connect51.com
#Connect51 #ResearchManagement #ResearchImpact #OpenAlex #Bibliometrics
See more →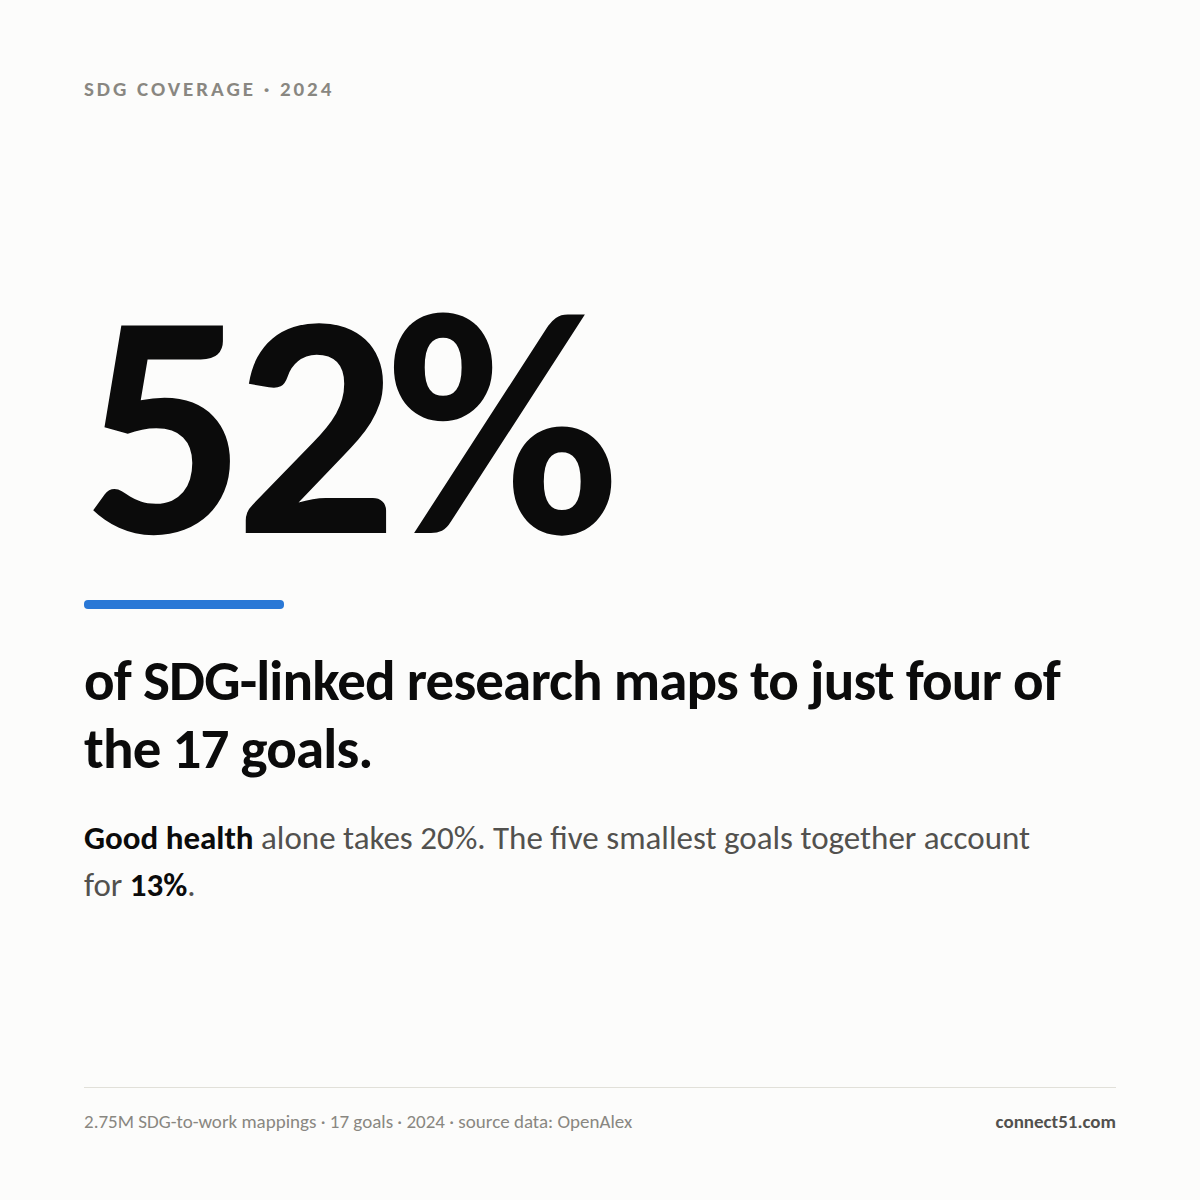
In 2024, four of the 17 Sustainable Development Goals absorbed 52% of all SDG-linked university research output.
In 2024, four of the 17 Sustainable Development Goals absorbed 52% of all SDG-linked university research output. Good Health alone took 20% — nearly four times the combined output of No Poverty, Partnerships and Responsible Consumption.
For a research office, this is the gap between an SDG portfolio and an SDG strategy. Most SDG profiles are a by-product of where medical and agricultural strength already sits, rather than a deliberate choice. The thinnest-covered goals are also where a mid-sized university can still be visible.
If you want to see how your institution's SDG mix compares with this global distribution, we run free Connect51 trials for research offices — comment or DM me, or take a look at https://www.connect51.com
#Connect51 #ResearchManagement #ResearchImpact #OpenAlex #Bibliometrics
See more →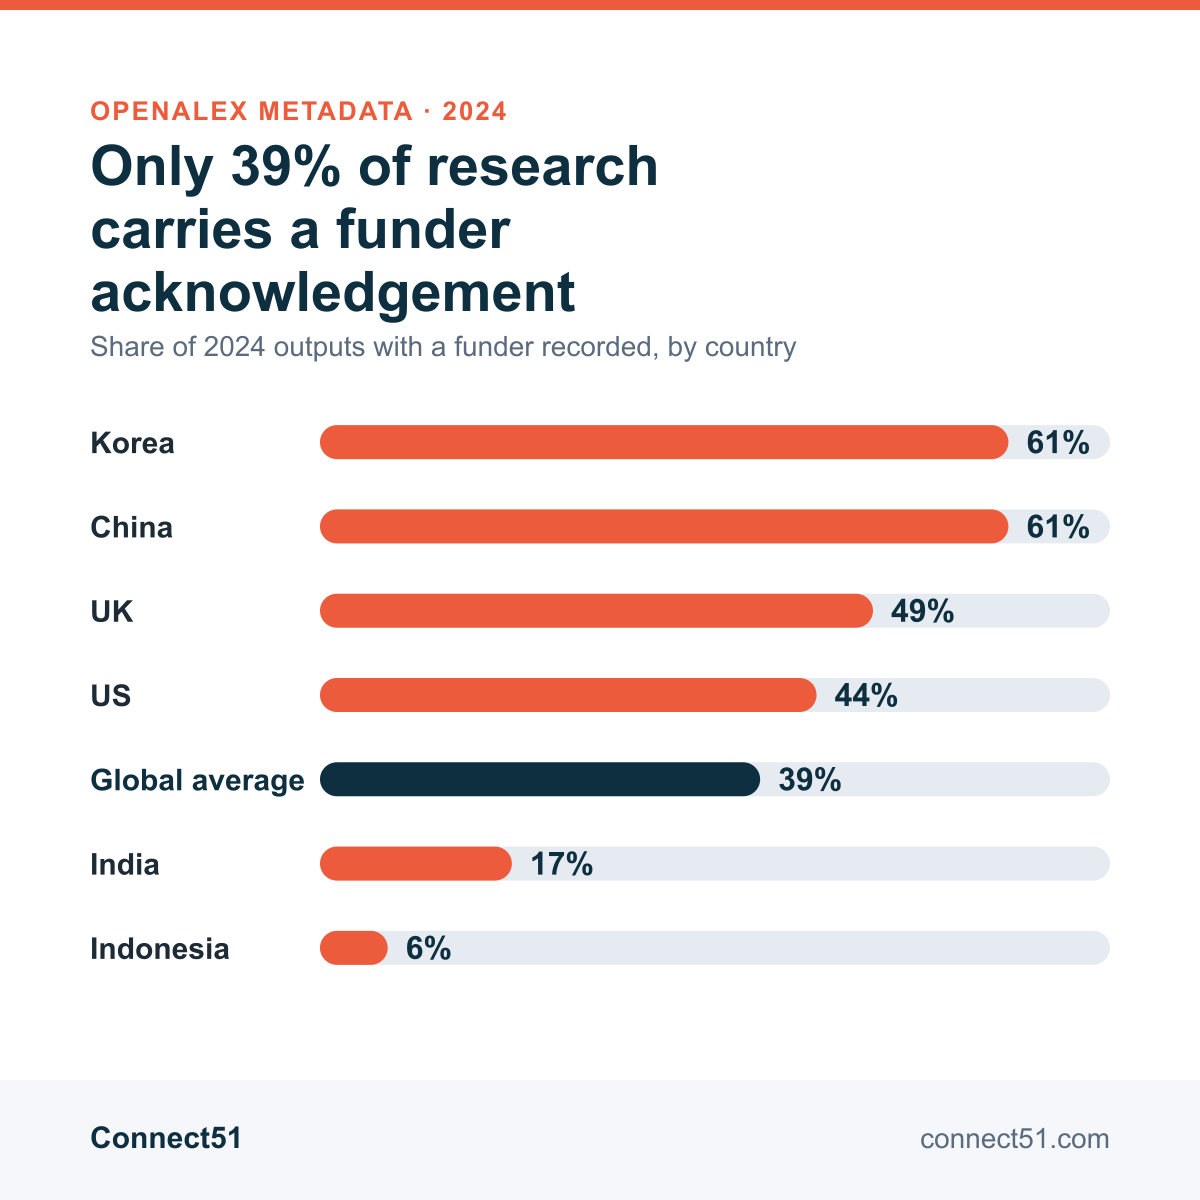
Only 39% of research carries a funder acknowledgement
Only 39% of university research published in 2024 carries a funder acknowledgement in its metadata. The other 5.5 million outputs name no funder at all, and that share has not moved since 2021.
The gap is national rather than disciplinary: Korean and Chinese universities record a funder on about 61% of output, the UK 49%, the US 44%, India 17%, Indonesia 6%. If your funded-output reporting rests on this metadata, you are undercounting your own grant returns, and any international benchmark is partly measuring acknowledgement practice rather than funding.
Worth knowing your own acknowledgement rate before the next impact return. We run free Connect51 trials for research offices, so comment or DM me, or take a look at https://www.connect51.com
See more →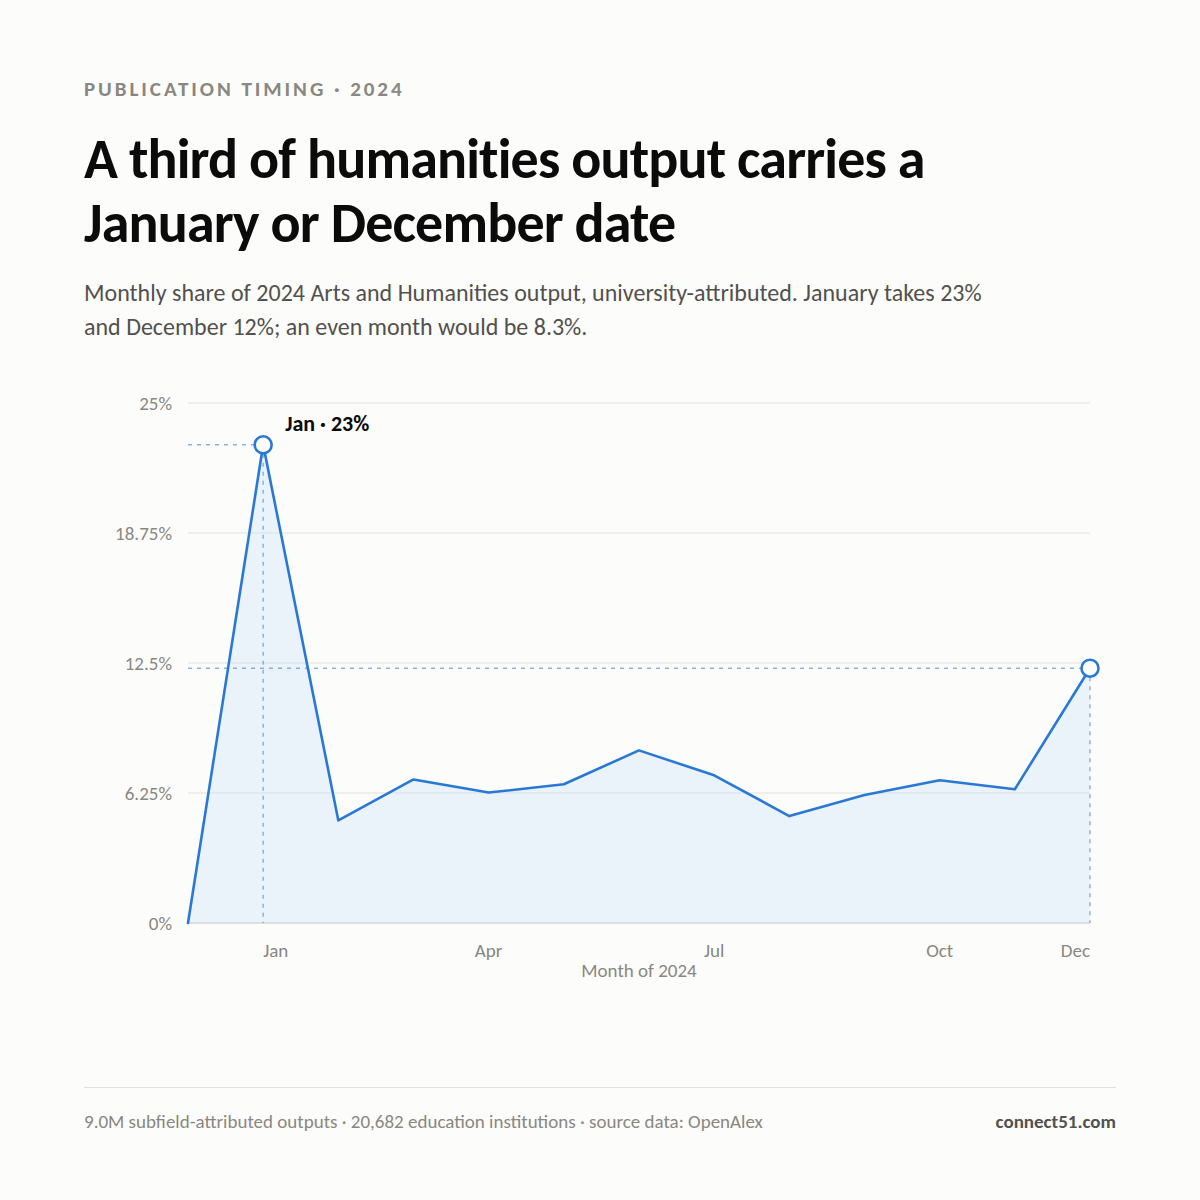
Across 2024, 35% of university Arts and Humanities output carries a January or December publication date.
Across 2024, 35% of university Arts and Humanities output carries a January or December publication date. In Health Sciences it is 22%. An even spread would put both near 17%.
That gap is metadata convention, not a year-end rush: year-only and issue-only dates default to the year boundary, and humanities journals use them far more. If your office runs a census date or annual return off publication date, you are mis-timing humanities output against STEM.
Want to see how your own disciplinary mix skews date-based reporting? We run free Connect51 trials for research offices — comment or DM me, or visit https://www.connect51.com
#Connect51 #ResearchManagement #ResearchImpact #OpenAlex #ResearchOffice
See more →.png)
 Danielle SwanepoelExecutive Director of International Relations and Strategic Initiatives
 Kunnikar KanatharanaStrategic Advisor - University Rankings